
 Burton
Next fixture
v Burton
Home · Sat, 31 Oct 2026 · · Round 14
- v HuddersfieldSat, 14 Nov 2026
- at OxfordSat, 21 Nov 2026
- v BradfordSat, 28 Nov 2026
Restored from the 11 October backup. Current updates are not connected.
League position
15th
of 24 clubs
Last five, oldest to newest
DWWDL2 won4 drawn3 lost
Next stored match · all competitions
v BurtonFrom the stored schedule. Current updates are not connected.
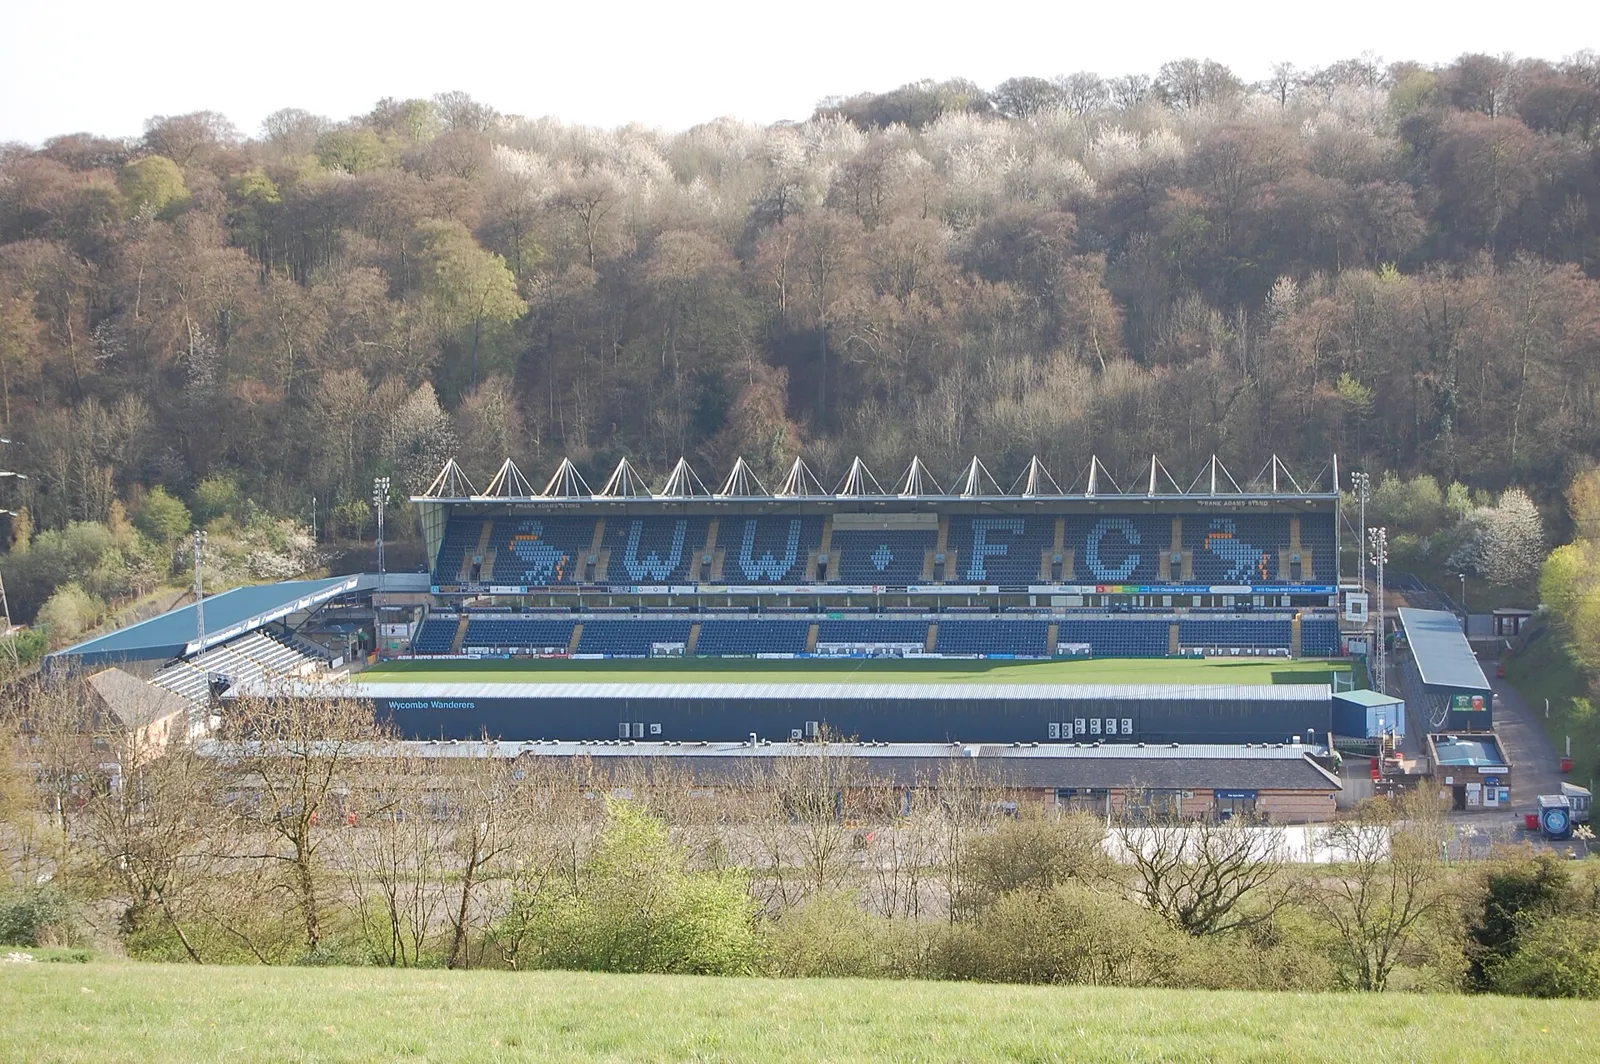
Adams Park. Photo: DipsyDave, CC BY-SA 3.0, cropped and resized.
Advertise with MatchDaySync
Reach readers who check the numbers
MatchDaySync pages are built around fixtures, tables and club statistics. Ask about a placement.
Points gathered after every stored result in EFL League One 2026-27.
Free on MatchDaySync
Compare two clubs side by side
Recent form, shared ranks and league baselines, from stored results.
Home · Sat, 31 Oct 2026 · · Round 14
4 past matches have no stored result yet.
From the GKM network
GKM Strategic Advisory and AI
Research, strategic advice, training, AI and digital solutions for institutions, businesses and individuals.
The same club on two grounds. The brighter figure on each line is the stronger side.
| P | W | D | L | GF | GA | GD | PPG | |
|---|---|---|---|---|---|---|---|---|
| Overall | 9 | 2 | 4 | 3 | 14 | 20 | -6 | 1.11 |
| Home | 5 | 0 | 3 | 2 | 8 | 12 | -4 | 0.60 |
| Away | 4 | 2 | 1 | 1 | 6 | 8 | -2 | 1.75 |
The latest 10 scored full-time matches in EFL League One 2026-27. Showing 9 of 9 available; venue columns split this same window.
| Overall | Home | Away | |
|---|---|---|---|
| Played | 9 | ||
| Won | 2 | ||
| Drawn | 4 | ||
| Lost | 3 | ||
| Goals for | 14 | ||
| Goals against | 20 | ||
| Points per match | 1.11 | ||
| Both teams scored | 89% | ||
| Over 2.5 goals | 67% | ||
| Match corners | 11.00 | ||
| Corner sample | 8 | ||
| Match cards | 3.75 | ||
| Card sample | 8 |
Latest 9 result links shown; summaries use all 9 scored matches in this window.
Advertise with MatchDaySync
Advertise with MatchDaySync
Place your brand beside stored match data, tables and tools.
Select a venue within the same window chosen above. These are observed frequencies and measurements, with each denominator shown.
Club goals scored first, goals conceded second, including away matches. The last-10 scored-match window contains 9 source records before the all-venues filter; 9 remain in this venue. No older match replaces an unavailable score.
Full-time sample: 9. Half-time sample: 9. 0 selected records have ambiguous identities or invalid full-time scores; 0 full-time records have unavailable or inconsistent half-time scores. A missing half-time score never becomes 0–0.
| Club score | Matches | Rate |
|---|---|---|
| 1–1 | 2 of 9 | 22.2% |
| 1–0 | 1 of 9 | 11.1% |
| 1–2 | 1 of 9 | 11.1% |
| 1–4 | 1 of 9 | 11.1% |
| 1–5 | 1 of 9 | 11.1% |
| 2–2 | 1 of 9 | 11.1% |
| 3–2 | 1 of 9 | 11.1% |
| 3–3 | 1 of 9 | 11.1% |
All 8 observed scorelines shown. Percentages are rounded to one decimal place.
| Club score | Matches | Rate |
|---|---|---|
| 0–0 | 2 of 9 | 22.2% |
| 1–2 | 2 of 9 | 22.2% |
| 0–1 | 1 of 9 | 11.1% |
| 0–2 | 1 of 9 | 11.1% |
| 1–0 | 1 of 9 | 11.1% |
| 2–0 | 1 of 9 | 11.1% |
| 2–1 | 1 of 9 | 11.1% |
All 7 observed scorelines shown. Percentages are rounded to one decimal place.
9 scored matches after the venue filter, from a last-10 window of 9 matches. 9 scored matches are available in this competition-season. Optional measurements are qualified inside this same window; missing values never become zero.
Every rate shows its count and measured-match denominator. Averages include their measured sample. Extrema link up to three matching records and disclose the total number of ties. No MatchDaySync forecast is used here; source xG is shown only where recorded.
Valid finished scores, with this club first. Points use 3 for a win and 1 for a draw.
| Statistic | Value | Measured sample |
|---|---|---|
| Scored matches | 9 | 9 matches |
| Goals scored | 14 | 9 matches |
| Goals conceded | 20 | 9 matches |
| Goals scored per match | 1.56 | 9 matches |
| Goals conceded per match | 2.22 | 9 matches |
| Match goals per match | 3.78 | 9 matches |
| Statistical points | 10 | 9 matches |
| Statistical points per match | 1.11 | 9 matches |
| Won | 22.2% | 2 of 9 |
| Drawn | 44.4% | 4 of 9 |
| Lost | 33.3% | 3 of 9 |
| Clean sheets | 11.1% | 1 of 9 |
| Failed to score | 0.0% | 0 of 9 |
| Both teams scored | 88.9% | 8 of 9 |
| Lowest goals scored2026-10-10, 2026-09-19, 2026-09-01; 3 of 6 tied records shown | 1 | 9 matches |
| Highest goals scored2026-09-12, 2026-09-05; 2 tied records | 3 | 9 matches |
| Lowest goals conceded2026-09-19 | 0 | 9 matches |
| Highest goals conceded2026-08-29 | 5 | 9 matches |
| Lowest club goal margin2026-08-29 | -4 | 9 matches |
| Highest club goal margin2026-09-19, 2026-09-12; 2 tied records | 1 | 9 matches |
Every percentage uses the selected valid full-time score sample.
| Statistic | Value | Measured sample |
|---|---|---|
| Match goals over 0.5 | 100.0% | 9 of 9 |
| Match goals under 0.5 | 0.0% | 0 of 9 |
| Match goals over 1.5 | 88.9% | 8 of 9 |
| Match goals under 1.5 | 11.1% | 1 of 9 |
| Match goals over 2.5 | 66.7% | 6 of 9 |
| Match goals under 2.5 | 33.3% | 3 of 9 |
| Match goals over 3.5 | 55.6% | 5 of 9 |
| Match goals under 3.5 | 44.4% | 4 of 9 |
| Match goals over 4.5 | 44.4% | 4 of 9 |
| Match goals under 4.5 | 55.6% | 5 of 9 |
| Match goals over 5.5 | 22.2% | 2 of 9 |
| Match goals under 5.5 | 77.8% | 7 of 9 |
| Club goals scored over 0.5 | 100.0% | 9 of 9 |
| Club goals scored over 1.5 | 33.3% | 3 of 9 |
| Club goals scored over 2.5 | 22.2% | 2 of 9 |
| Club goals scored over 3.5 | 0.0% | 0 of 9 |
| Club goals conceded over 0.5 | 88.9% | 8 of 9 |
| Club goals conceded over 1.5 | 66.7% | 6 of 9 |
| Club goals conceded over 2.5 | 33.3% | 3 of 9 |
| Club goals conceded over 3.5 | 22.2% | 2 of 9 |
| Club scored exactly 0 | 0.0% | 0 of 9 |
| Club conceded exactly 0 | 11.1% | 1 of 9 |
| Club scored exactly 1 | 66.7% | 6 of 9 |
| Club conceded exactly 1 | 22.2% | 2 of 9 |
| Club scored exactly 2 | 11.1% | 1 of 9 |
| Club conceded exactly 2 | 33.3% | 3 of 9 |
| Club scored exactly 3 | 22.2% | 2 of 9 |
| Club conceded exactly 3 | 11.1% | 1 of 9 |
| Match total exactly 0 | 0.0% | 0 of 9 |
| Match total exactly 1 | 11.1% | 1 of 9 |
| Match total exactly 2 | 22.2% | 2 of 9 |
| Match total exactly 3 | 11.1% | 1 of 9 |
| Match total exactly 4 | 11.1% | 1 of 9 |
| Match total exactly 5 | 22.2% | 2 of 9 |
| Match total exactly 6 | 22.2% | 2 of 9 |
| Match total exactly 7 | 0.0% | 0 of 9 |
| Match total 8 or more | 0.0% | 0 of 9 |
Joint conditions use all selected scored matches, not only the matches where both teams scored.
| Statistic | Value | Measured sample |
|---|---|---|
| Both scored and club won | 11.1% | 1 of 9 |
| Both scored and draw | 44.4% | 4 of 9 |
| Both scored and club lost | 33.3% | 3 of 9 |
| Over 2.5 goals and both scored | 66.7% | 6 of 9 |
| Over 2.5 goals and at least one side blank | 0.0% | 0 of 9 |
Valid paired HT/FT scores: 9 of 9. Missing or inconsistent pairs are excluded.
| Statistic | Value | Measured sample |
|---|---|---|
| Club goals scored | 7 | 9 matches |
| Club goals conceded | 8 | 9 matches |
| Club goals scored per match | 0.78 | 9 matches |
| Club goals conceded per match | 0.89 | 9 matches |
| Statistical period points | 11 | 9 matches |
| Statistical period points per match | 1.22 | 9 matches |
| Led in this half | 33.3% | 3 of 9 |
| Level in this half | 22.2% | 2 of 9 |
| Trailed in this half | 44.4% | 4 of 9 |
| Both teams scored in this half | 33.3% | 3 of 9 |
| Club clean sheet in this half | 44.4% | 4 of 9 |
| Club did not score in this half | 44.4% | 4 of 9 |
| Half match goals over 0.5 | 77.8% | 7 of 9 |
| Half match goals under 0.5 | 22.2% | 2 of 9 |
| Half match goals over 1.5 | 55.6% | 5 of 9 |
| Half match goals under 1.5 | 44.4% | 4 of 9 |
| Half match goals over 2.5 | 33.3% | 3 of 9 |
| Half match goals under 2.5 | 66.7% | 6 of 9 |
| Half match goals over 3.5 | 0.0% | 0 of 9 |
| Half match goals under 3.5 | 100.0% | 9 of 9 |
Valid paired HT/FT scores: 9 of 9. Missing or inconsistent pairs are excluded.
| Statistic | Value | Measured sample |
|---|---|---|
| Club goals scored | 7 | 9 matches |
| Club goals conceded | 12 | 9 matches |
| Club goals scored per match | 0.78 | 9 matches |
| Club goals conceded per match | 1.33 | 9 matches |
| Statistical period points | 9 | 9 matches |
| Statistical period points per match | 1.00 | 9 matches |
| Led in this half | 22.2% | 2 of 9 |
| Level in this half | 33.3% | 3 of 9 |
| Trailed in this half | 44.4% | 4 of 9 |
| Both teams scored in this half | 44.4% | 4 of 9 |
| Club clean sheet in this half | 33.3% | 3 of 9 |
| Club did not score in this half | 33.3% | 3 of 9 |
| Half match goals over 0.5 | 88.9% | 8 of 9 |
| Half match goals under 0.5 | 11.1% | 1 of 9 |
| Half match goals over 1.5 | 55.6% | 5 of 9 |
| Half match goals under 1.5 | 44.4% | 4 of 9 |
| Half match goals over 2.5 | 44.4% | 4 of 9 |
| Half match goals under 2.5 | 55.6% | 5 of 9 |
| Half match goals over 3.5 | 22.2% | 2 of 9 |
| Half match goals under 3.5 | 77.8% | 7 of 9 |
All conditions share the same valid HT/FT sample; the halves are never inferred from a final score alone.
| Statistic | Value | Measured sample |
|---|---|---|
| Club scored in both halves | 22.2% | 2 of 9 |
| Both scored: 1H no, 2H no | 33.3% | 3 of 9 |
| Both scored: 1H no, 2H yes | 33.3% | 3 of 9 |
| Both scored: 1H yes, 2H no | 22.2% | 2 of 9 |
| Both scored: 1H yes, 2H yes | 11.1% | 1 of 9 |
| First half had more match goals | 22.2% | 2 of 9 |
| Halves level on match goals | 33.3% | 3 of 9 |
| Second half had more match goals | 44.4% | 4 of 9 |
Both sides must have valid full-match corner counts. Corner-leader win rates exclude tied corner totals.
| Statistic | Value | Measured sample |
|---|---|---|
| Club per match | 5.50 | 8 matches |
| Opponent per match | 5.50 | 8 matches |
| Match total per match | 11.00 | 8 matches |
| Recorded club total | 44 | 8 matches |
| Lowest club total2026-08-15 | 4 | 8 matches |
| Highest club total2026-09-12 | 9 | 8 matches |
| Recorded opponent total | 44 | 8 matches |
| Lowest opponent total2026-09-19 | 4 | 8 matches |
| Highest opponent total2026-09-26 | 7 | 8 matches |
| Recorded match total | 88 | 8 matches |
| Lowest match total2026-09-19, 2026-08-15; 2 tied records | 9 | 8 matches |
| Highest match total2026-09-12 | 15 | 8 matches |
| Club over 2.5 | 100.0% | 8 of 8 |
| Club over 3.5 | 100.0% | 8 of 8 |
| Club over 4.5 | 87.5% | 7 of 8 |
| Club over 5.5 | 25.0% | 2 of 8 |
| Club over 6.5 | 12.5% | 1 of 8 |
| Club over 7.5 | 12.5% | 1 of 8 |
| Club over 8.5 | 12.5% | 1 of 8 |
| Opponent over 2.5 | 100.0% | 8 of 8 |
| Opponent over 3.5 | 100.0% | 8 of 8 |
| Opponent over 4.5 | 87.5% | 7 of 8 |
| Opponent over 5.5 | 50.0% | 4 of 8 |
| Opponent over 6.5 | 12.5% | 1 of 8 |
| Opponent over 7.5 | 0.0% | 0 of 8 |
| Opponent over 8.5 | 0.0% | 0 of 8 |
| Match total over 6.5 | 100.0% | 8 of 8 |
| Match total under 6.5 | 0.0% | 0 of 8 |
| Match total over 7.5 | 100.0% | 8 of 8 |
| Match total under 7.5 | 0.0% | 0 of 8 |
| Match total over 8.5 | 100.0% | 8 of 8 |
| Match total under 8.5 | 0.0% | 0 of 8 |
| Match total over 9.5 | 75.0% | 6 of 8 |
| Match total under 9.5 | 25.0% | 2 of 8 |
| Match total over 10.5 | 50.0% | 4 of 8 |
| Match total under 10.5 | 50.0% | 4 of 8 |
| Match total over 11.5 | 37.5% | 3 of 8 |
| Match total under 11.5 | 62.5% | 5 of 8 |
| Match total over 12.5 | 12.5% | 1 of 8 |
| Match total under 12.5 | 87.5% | 7 of 8 |
| Match total over 13.5 | 12.5% | 1 of 8 |
| Match total under 13.5 | 87.5% | 7 of 8 |
| Match total over 14.5 | 12.5% | 1 of 8 |
| Match total under 14.5 | 87.5% | 7 of 8 |
| Tied corner totals, excluded from leader rate | 3 | 8 matches |
| Unique corner-leading side won the match | 60.0% | 3 of 5 |
Both sides must have valid full-match yellow and red card counts. Cards are yellow plus red as published; no incident-level reconstruction.
| Statistic | Value | Measured sample |
|---|---|---|
| Club per match | 1.38 | 8 matches |
| Opponent per match | 2.38 | 8 matches |
| Match total per match | 3.75 | 8 matches |
| Recorded club total | 11 | 8 matches |
| Lowest club total2026-09-05, 2026-08-29; 2 tied records | 0 | 8 matches |
| Highest club total2026-09-12, 2026-08-15; 2 tied records | 3 | 8 matches |
| Recorded opponent total | 19 | 8 matches |
| Lowest opponent total2026-09-12, 2026-08-29; 2 tied records | 0 | 8 matches |
| Highest opponent total2026-09-19 | 6 | 8 matches |
| Recorded match total | 30 | 8 matches |
| Lowest match total2026-08-29 | 0 | 8 matches |
| Highest match total2026-09-19 | 7 | 8 matches |
| Club over 0.5 | 75.0% | 6 of 8 |
| Club over 1.5 | 37.5% | 3 of 8 |
| Club over 2.5 | 25.0% | 2 of 8 |
| Club over 3.5 | 0.0% | 0 of 8 |
| Club over 4.5 | 0.0% | 0 of 8 |
| Club over 5.5 | 0.0% | 0 of 8 |
| Club over 6.5 | 0.0% | 0 of 8 |
| Club over 7.5 | 0.0% | 0 of 8 |
| Club over 8.5 | 0.0% | 0 of 8 |
| Opponent over 0.5 | 75.0% | 6 of 8 |
| Opponent over 1.5 | 75.0% | 6 of 8 |
| Opponent over 2.5 | 50.0% | 4 of 8 |
| Opponent over 3.5 | 12.5% | 1 of 8 |
| Opponent over 4.5 | 12.5% | 1 of 8 |
| Opponent over 5.5 | 12.5% | 1 of 8 |
| Opponent over 6.5 | 0.0% | 0 of 8 |
| Opponent over 7.5 | 0.0% | 0 of 8 |
| Opponent over 8.5 | 0.0% | 0 of 8 |
| Match total over 0.5 | 87.5% | 7 of 8 |
| Match total under 0.5 | 12.5% | 1 of 8 |
| Match total over 1.5 | 87.5% | 7 of 8 |
| Match total under 1.5 | 12.5% | 1 of 8 |
| Match total over 2.5 | 87.5% | 7 of 8 |
| Match total under 2.5 | 12.5% | 1 of 8 |
| Match total over 3.5 | 50.0% | 4 of 8 |
| Match total under 3.5 | 50.0% | 4 of 8 |
| Match total over 4.5 | 37.5% | 3 of 8 |
| Match total under 4.5 | 62.5% | 5 of 8 |
| Match total over 5.5 | 12.5% | 1 of 8 |
| Match total under 5.5 | 87.5% | 7 of 8 |
| Match total over 6.5 | 12.5% | 1 of 8 |
| Match total under 6.5 | 87.5% | 7 of 8 |
| Match total over 7.5 | 0.0% | 0 of 8 |
| Match total under 7.5 | 100.0% | 8 of 8 |
| Match total over 8.5 | 0.0% | 0 of 8 |
| Match total under 8.5 | 100.0% | 8 of 8 |
| Club yellow per match | 1.38 | 8 matches |
| Opponent yellow per match | 2.38 | 8 matches |
| Club yellow total | 11 | 8 matches |
| Opponent yellow total | 19 | 8 matches |
| Club red per match | 0.00 | 8 matches |
| Opponent red per match | 0.00 | 8 matches |
| Club red total | 0 | 8 matches |
| Opponent red total | 0 | 8 matches |
Both sides must have this source measurement; its sample is independent of corners, cards and the other shot measurements.
| Statistic | Value | Measured sample |
|---|---|---|
| Club shots per match | 12.13 | 8 matches |
| Opponent shots per match | 15.50 | 8 matches |
| Match total per match | 27.63 | 8 matches |
| Recorded match total | 221 | 8 matches |
| Lowest match total2026-09-05 | 21 | 8 matches |
| Highest match total2026-09-26 | 38 | 8 matches |
| Club shots total | 97 | 8 matches |
| Lowest club shots2026-08-29 | 7 | 8 matches |
| Highest club shots2026-09-26 | 17 | 8 matches |
| Opponent shots total | 124 | 8 matches |
| Lowest opponent shots2026-09-19, 2026-09-05, 2026-08-22; 3 tied records | 12 | 8 matches |
| Highest opponent shots2026-09-26 | 21 | 8 matches |
| Match total over 22.5 | 87.5% | 7 of 8 |
| Match total under 22.5 | 12.5% | 1 of 8 |
| Match total over 23.5 | 75.0% | 6 of 8 |
| Match total under 23.5 | 25.0% | 2 of 8 |
| Match total over 24.5 | 62.5% | 5 of 8 |
| Match total under 24.5 | 37.5% | 3 of 8 |
| Match total over 25.5 | 62.5% | 5 of 8 |
| Match total under 25.5 | 37.5% | 3 of 8 |
| Match total over 26.5 | 50.0% | 4 of 8 |
| Match total under 26.5 | 50.0% | 4 of 8 |
| Club over 10.5 | 75.0% | 6 of 8 |
| Club over 11.5 | 50.0% | 4 of 8 |
| Club over 12.5 | 50.0% | 4 of 8 |
| Club over 13.5 | 50.0% | 4 of 8 |
| Club over 14.5 | 12.5% | 1 of 8 |
| Club over 15.5 | 12.5% | 1 of 8 |
| Goals per100 club shots | 13.40% | 8 matches13 / 97 ×100 |
| Club shots per goal scored | 7.46 | 8 matches97 / 13 |
| Opponent shots per goal conceded | 7.75 | 8 matches124 / 16 |
Both sides must have this source measurement; its sample is independent of corners, cards and the other shot measurements.
| Statistic | Value | Measured sample |
|---|---|---|
| Club on target per match | 5.00 | 8 matches |
| Opponent on target per match | 5.25 | 8 matches |
| Match total per match | 10.25 | 8 matches |
| Recorded match total | 82 | 8 matches |
| Lowest match total2026-09-19 | 3 | 8 matches |
| Highest match total2026-09-01 | 13 | 8 matches |
| Club on target total | 40 | 8 matches |
| Lowest club on target2026-09-19 | 1 | 8 matches |
| Highest club on target2026-09-12, 2026-09-05; 2 tied records | 7 | 8 matches |
| Opponent on target total | 42 | 8 matches |
| Lowest opponent on target2026-09-19 | 2 | 8 matches |
| Highest opponent on target2026-09-26, 2026-09-01, 2026-08-29; 3 of 4 tied records shown | 7 | 8 matches |
| Match total over 7.5 | 87.5% | 7 of 8 |
| Match total under 7.5 | 12.5% | 1 of 8 |
| Match total over 8.5 | 75.0% | 6 of 8 |
| Match total under 8.5 | 25.0% | 2 of 8 |
| Match total over 9.5 | 75.0% | 6 of 8 |
| Match total under 9.5 | 25.0% | 2 of 8 |
| Club over 3.5 | 87.5% | 7 of 8 |
| Club over 4.5 | 75.0% | 6 of 8 |
| Club over 5.5 | 37.5% | 3 of 8 |
| Club over 6.5 | 25.0% | 2 of 8 |
Both sides must have this source measurement; its sample is independent of corners, cards and the other shot measurements.
| Statistic | Value | Measured sample |
|---|---|---|
| Club off target per match | 7.13 | 8 matches |
| Opponent off target per match | 10.25 | 8 matches |
| Match total per match | 17.38 | 8 matches |
| Recorded match total | 139 | 8 matches |
| Lowest match total2026-09-05 | 9 | 8 matches |
| Highest match total2026-09-26 | 26 | 8 matches |
| Club off target total | 57 | 8 matches |
| Lowest club off target2026-09-05, 2026-08-29; 2 tied records | 2 | 8 matches |
| Highest club off target2026-09-26 | 12 | 8 matches |
| Opponent off target total | 82 | 8 matches |
| Lowest opponent off target2026-09-05 | 7 | 8 matches |
| Highest opponent off target2026-09-26 | 14 | 8 matches |
Both sides’ committed fouls must be measured. Opponent committed fouls are not relabelled fouls drawn.
| Statistic | Value | Measured sample |
|---|---|---|
| Club committed fouls per match | 10.00 | 8 matches |
| Opponent committed fouls per match | 13.50 | 8 matches |
| Match total per match | 23.50 | 8 matches |
| Recorded match total | 188 | 8 matches |
| Lowest match total2026-08-29 | 14 | 8 matches |
| Highest match total2026-09-05 | 27 | 8 matches |
| Club committed fouls total | 80 | 8 matches |
| Lowest club committed fouls2026-09-19, 2026-08-29; 2 tied records | 8 | 8 matches |
| Highest club committed fouls2026-08-15 | 15 | 8 matches |
| Opponent committed fouls total | 108 | 8 matches |
| Lowest opponent committed fouls2026-08-29 | 6 | 8 matches |
| Highest opponent committed fouls2026-09-05 | 18 | 8 matches |
Both sides must have this source measurement; its sample is independent of corners, cards and the other shot measurements.
| Statistic | Value | Measured sample |
|---|---|---|
| Club source xG per match | 1.39 | 8 matches |
| Opponent source xG per match | 1.38 | 8 matches |
| Match total per match | 2.77 | 8 matches |
| Recorded match total | 22.13 | 8 matches |
| Club source xG total | 11.08 | 8 matches |
| Opponent source xG total | 11.05 | 8 matches |
Season averages from stored matches. Faded figures rest on fewer than 3 matches; hover for the sample.
| Overall | Home | Away | |
|---|---|---|---|
| Played | 9 | ||
| Won | 2 | ||
| Drawn | 4 | ||
| Lost | 3 | ||
| Scored per match | 1.56 | ||
| Conceded per match | 2.22 | ||
| Avg total goals | 3.78 | ||
| Clean sheets | 11% | ||
| Failed to score | 0% | ||
| Points per match | 1.11 |
| Overall | Home | Away | |
|---|---|---|---|
| Over 0.5 goals | 100% | ||
| Over 1.5 goals | 89% | ||
| Over 2.5 goals | 67% | ||
| Over 3.5 goals | 56% | ||
| Over 4.5 goals | 44% | ||
| Under 2.5 goals | 33% | ||
| Both teams scored | 89% | ||
| Scored over 1.5 | 33% | ||
| Conceded over 1.5 | 67% |
| Overall | Home | Away | |
|---|---|---|---|
| Leading at HT | 3 | ||
| Level at HT | 2 | ||
| Trailing at HT | 4 | ||
| 1st-half goals for | 0.78 | ||
| 1st-half goals against | 0.89 | ||
| 1st half over 0.5 | 78% | ||
| 2nd-half goals for | 0.78 | ||
| 2nd-half goals against | 1.33 | ||
| 2nd half over 1.5 | 56% | ||
| Scored in both halves | 22% |
| Overall | Home | Away | |
|---|---|---|---|
| Corners for | 5.50 | ||
| Corners against | 5.50 | ||
| Match corners | 11.00 | ||
| Match over 8.5 | 100% | ||
| Match over 9.5 | 75% | ||
| Match over 10.5 | 50% |
| Overall | Home | Away | |
|---|---|---|---|
| Cards for | 1.38 | ||
| Cards against | 2.38 | ||
| Match cards | 3.75 | ||
| Match over 3.5 | 50% | ||
| Match over 4.5 | 38% |
| Overall | Home | Away | |
|---|---|---|---|
| Shots for | 12.13 | ||
| Shots against | 15.50 | ||
| On target for | 5.00 | ||
| On target against | 5.25 | ||
| Shot conversion | 13% | ||
| xG for | 1.39 | ||
| xG against | 1.38 | ||
| Fouls committed | 10.00 | ||
| Offsides | – |
Both teams scored and Wycombe won: 1 of 9 matches.
Free on MatchDaySync
Form guide
Which clubs are in form, read from recent stored matches.
League averages are per club per match (match totals halved where relevant).
| Date | Opponent | H/A | Score | HT | Corners | Cards | Shots |
|---|---|---|---|---|---|---|---|
| Sat, 15 Aug 2026 | Blackpool | A | 1–1 | 1–0 | 4–5 | 3–2 | 11–20 |
| Sat, 22 Aug 2026 | Plymouth | H | 1–1 | 0–1 | 5–5 | 1–3 | 14–12 |
| Sat, 29 Aug 2026 | Stockport | A | 1–5 | 1–2 | 5–6 | 0–0 | 7–17 |
| Tue, 1 Sept 2026 | Sheffield Weds | H | 1–2 | 1–2 | 6–6 | 1–2 | 14–16 |
| Sat, 5 Sept 2026 | Milton Keynes Dons | H | 3–3 | 2–0 | 5–5 | 0–3 | 9–12 |
| Sat, 12 Sept 2026 | Leyton Orient | A | 3–2 | 2–1 | 9–6 | 3–0 | 14–14 |
| Sat, 19 Sept 2026 | Wigan | A | 1–0 | 0–0 | 5–4 | 1–6 | 11–12 |
| Sat, 26 Sept 2026 | Reading | H | 2–2 | 0–0 | 5–7 | 2–3 | 17–21 |
| Sat, 3 Oct 2026 | Bromley | A | Result pending | – | – | – | – |
| Sat, 10 Oct 2026 | Luton | H | 1–4 | 0–2 | – | – | – |
| Sat, 17 Oct 2026 | Notts County | H | Result pending | – | – | – | – |
| Tue, 20 Oct 2026 | Cambridge | A | Result pending | – | – | – | – |
| Sat, 24 Oct 2026 | AFC Wimbledon | A | Result pending | – | – | – | – |
| Sat, 31 Oct 2026 | Burton | H | vs | – | – | – | – |
| Sat, 14 Nov 2026 | Huddersfield | H | vs | – | – | – | – |
| Sat, 21 Nov 2026 | Oxford | A | vs | – | – | – | – |
| Sat, 28 Nov 2026 | Bradford | H | vs | – | – | – | – |
| Tue, 1 Dec 2026 | Barnsley | A | vs | – | – | – | – |
| Sat, 12 Dec 2026 | Mansfield | A | vs | – | – | – | – |
| Sat, 19 Dec 2026 | Doncaster | H | vs | – | – | – | – |
| Sat, 26 Dec 2026 | Peterboro | A | vs | – | – | – | – |
| Tue, 29 Dec 2026 | Stevenage | H | vs | – | – | – | – |
| Fri, 1 Jan 2027 | Leicester | H | vs | – | – | – | – |
| Sat, 9 Jan 2027 | Doncaster | A | vs | – | – | – | – |
| Sat, 16 Jan 2027 | Notts County | A | vs | – | – | – | – |
| Tue, 19 Jan 2027 | Cambridge | H | vs | – | – | – | – |
| Sat, 23 Jan 2027 | AFC Wimbledon | H | vs | – | – | – | – |
| Sat, 30 Jan 2027 | Burton | A | vs | – | – | – | – |
| Sat, 6 Feb 2027 | Stockport | H | vs | – | – | – | – |
| Tue, 9 Feb 2027 | Sheffield Weds | A | vs | – | – | – | – |
| Sat, 13 Feb 2027 | Milton Keynes Dons | A | vs | – | – | – | – |
| Sat, 20 Feb 2027 | Leyton Orient | H | vs | – | – | – | – |
| Sat, 27 Feb 2027 | Huddersfield | A | vs | – | – | – | – |
| Sat, 6 Mar 2027 | Blackpool | H | vs | – | – | – | – |
| Sat, 13 Mar 2027 | Plymouth | A | vs | – | – | – | – |
| Sat, 20 Mar 2027 | Oxford | H | vs | – | – | – | – |
| Fri, 26 Mar 2027 | Leicester | A | vs | – | – | – | – |
| Mon, 29 Mar 2027 | Peterboro | H | vs | – | – | – | – |
| Sat, 3 Apr 2027 | Stevenage | A | vs | – | – | – | – |
| Sat, 10 Apr 2027 | Mansfield | H | vs | – | – | – | – |
| Tue, 13 Apr 2027 | Reading | A | vs | – | – | – | – |
| Sat, 17 Apr 2027 | Wigan | H | vs | – | – | – | – |
| Sat, 24 Apr 2027 | Luton | A | vs | – | – | – | – |
| Tue, 27 Apr 2027 | Bromley | H | vs | – | – | – | – |
| Sat, 1 May 2027 | Bradford | A | vs | – | – | – | – |
| Sat, 8 May 2027 | Barnsley | H | vs | – | – | – | – |
Score, corners, cards and shots shown as Wycombe first.
From the GKM network
Explore Ghana Guide
Thoughtful starting points for visiting, returning to, living in and investing in Ghana.
Statistics only, not advice. Not affiliated with any league or club.
From the GKM network
The Dental Protocol
Science-backed oral microbiome protocols, for bad breath, tonsil stones, receding gums and more.



 Luton
 Reading
 Wigan
 Leyton Orient
 Milton Keynes Dons
 Sheffield Weds
 Stockport
 Plymouth