
Field Notes
The desk's notebook: one statistic or one question at a time. Recent reporting appears alongside the restored archive. Each story keeps its own date and sources.
Filters include reviewed story associations only. Untagged stories remain in All clubs and All leagues.
Corners Over 7.5 at the World Cup: The Hardest Line on the Board
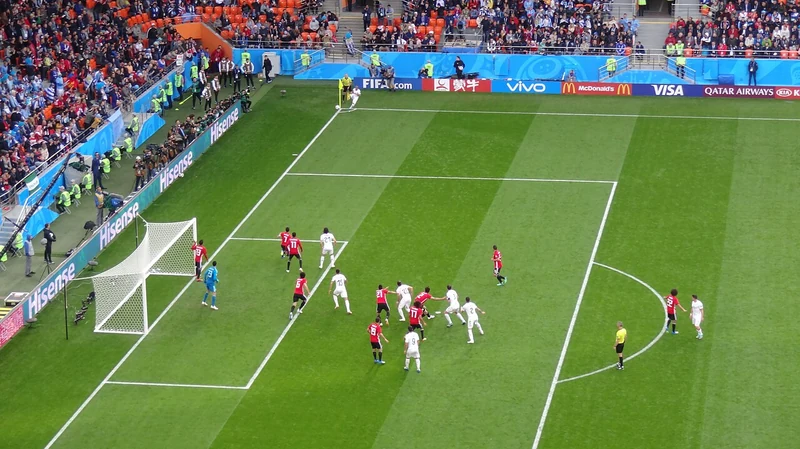
The board's toughest market closed at 62.5% (still clear of the coin-flip) and delivered a 22-corner classic on the model's six-of-six night.

Lyon supporters' tifo, Lyon v Auxerre, 27 October 2024. Photo: Sebleouf, CC BY-SA 4.0, cropped and resized.

Free on MatchDaySync
Read the model's estimates
Each estimate comes with the method behind it.
Fouls Over 18.5 at the World Cup: Projecting the Whistle
23.2 fouls per match, a 46-foul Final, and a 71.6% record: a season of learning to project the referee as much as the teams.

Felix Brych showing a yellow card during RB Leipzig–Union Berlin, 20 April 2022. Historical officiating illustration for the article’s fouls topic. It is not from the 2026 World Cup. Photo: Steffen Prößdorf / CC BY-SA 4.0. Original source. Resized and converted to WebP from the linked Commons file; aspect ratio retained. Licensed as linked. Shots on Target Over 6.5 at the World Cup: The Volatile Middle Child
From a 63.9% group stage to 13 of 16 in the Round of 32: the market that punishes wayward finishing found its range when the knockouts began.

Goalkeeper and goal-mouth action in the 2018 World Cup final, 15 July 2018. Historical illustration of the shots-on-target topic; this is not a photograph of the 2026 tournament. Photo: Meghdad Madadi / Tasnim News Agency / CC BY 4.0. Original source. Resized and converted to WebP from the linked Commons file; aspect ratio retained. Licensed as linked. Goals Over 0.5 at the World Cup: The Line That Barely Blinked
Eighty-one hits from 88 lines, a perfect Round of 32, and only seven goalless matches all cycle: the anchor market's tournament in review.
Goal-mouth action in the 2018 World Cup final, 15 July 2018. Historical goals illustration; this is not a photograph of the 2026 tournament. Photo: Meghdad Madadi / Tasnim News Agency / CC BY 4.0. Original source. Resized and converted to WebP from the linked Commons file; aspect ratio retained. Licensed as linked. Goals Over 1.5 at the World Cup: The Second Goal Is a Game-State Story
78.4% on the season and 14 of 16 in the knockouts: how the timing of the first goal quietly decided the fate of the second.

Brazil celebrating against Serbia at the 2022 World Cup. Historical goal-celebration illustration; this is not a photograph of the 2026 tournament. Photo: Hossein Zohrevand / Tasnim News Agency / CC BY 4.0. Original source. Resized and converted to WebP from the linked Commons file; aspect ratio retained. Licensed as linked.


From the GKM network
Explore Ghana Guide
Thoughtful starting points for visiting, returning to, living in and investing in Ghana.
Throw-Ins Over 30.5 at the World Cup: The Touchline Tells the Truth
Our signature market cleared its recalibrated line 69 times in 88 matches. What 36.6 throw-ins per game (and one strange ten-goal outlier) taught the model.

An Iceland throw-in during Nigeria–Iceland, 22 June 2018. Historical World Cup throw-in illustration; this is not a photograph of the 2026 tournament. Photo: Voltmetro / CC BY-SA 3.0. Original source. Resized and converted to WebP from the linked Commons file; aspect ratio retained. Licensed as linked. Where the Six Markets Go Next: The 2026-27 Season Plan
The World Cup was the warm-up. Twelve league hubs are open, three competitions get full matchday coverage, and the season scoreboard starts at zero.
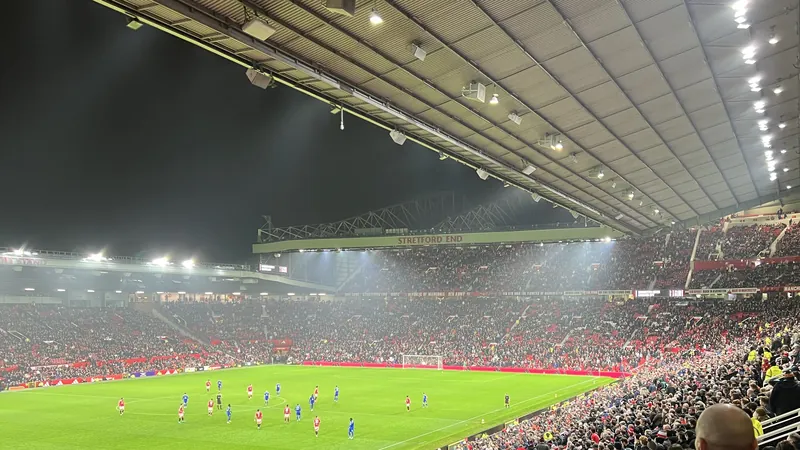
Old Trafford under floodlights, 30 October 2024, at the Manchester United v Leicester City League Cup tie. Illustration of a Premier League matchday for the multi-league season plan; this is not a 2026–27 match photograph. Photo: Fp0119 / CC BY 4.0. Original source. Cropped and resized from the original; licensed as linked. The Model Notebook: Six Markets, Ranked by Reliability
Not all markets are equal. Here is how our six lines performed in the 2026 group stage versus their long-run baselines, and which one is quietly the most consistent of all.
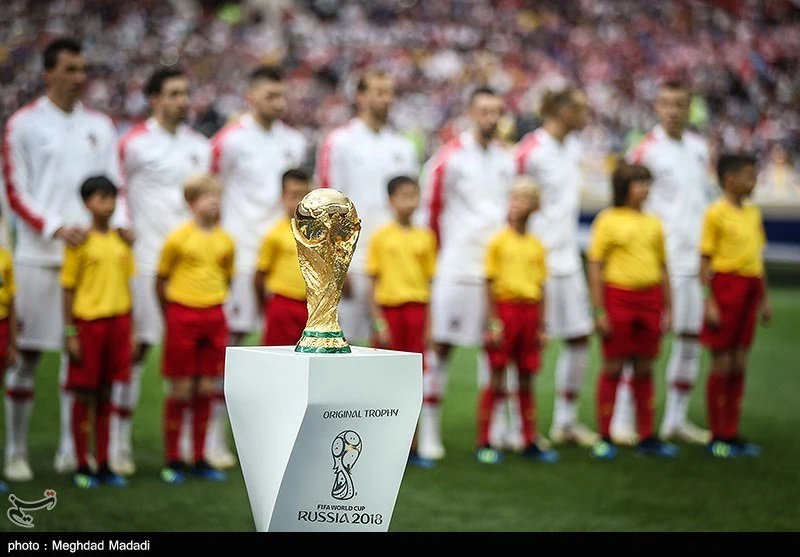
The trophy before the 2018 World Cup final, 15 July 2018. Historical tournament illustration for the model notebook; this is not a photograph of the 2026 tournament or evidence of model performance. Photo: Meghdad Madadi / Tasnim News Agency / CC BY 4.0. Original source. Resized and converted to WebP from the linked Commons file; aspect ratio retained. Licensed as linked.


Advertise with MatchDaySync
Advertise with MatchDaySync
Place your brand beside stored match data, tables and tools.
Keep reading
Guides, the archived record and the method behind the numbers.
How the desk works
Stories are written from official reports and stored results. Each keeps its own date and sources. Statistics only, never advice.
Free on MatchDaySync
Every free tool in one place
Finder, compare, predictions and more.
Browse the stored data
The tables, fixtures and statistics the stories draw on.