

Skip to content

Man United v Bournemouth, Premier League, Mon, 15 Dec 2025: statistics and head to head

2025-26. Mon, 15 Dec 2025

44Full time, half-time 2–1

Draw. Goal margin: 0.

WWDWWLeague form, oldest to newestDWWDD

Restored from the 11 October backup. Current updates are not connected.

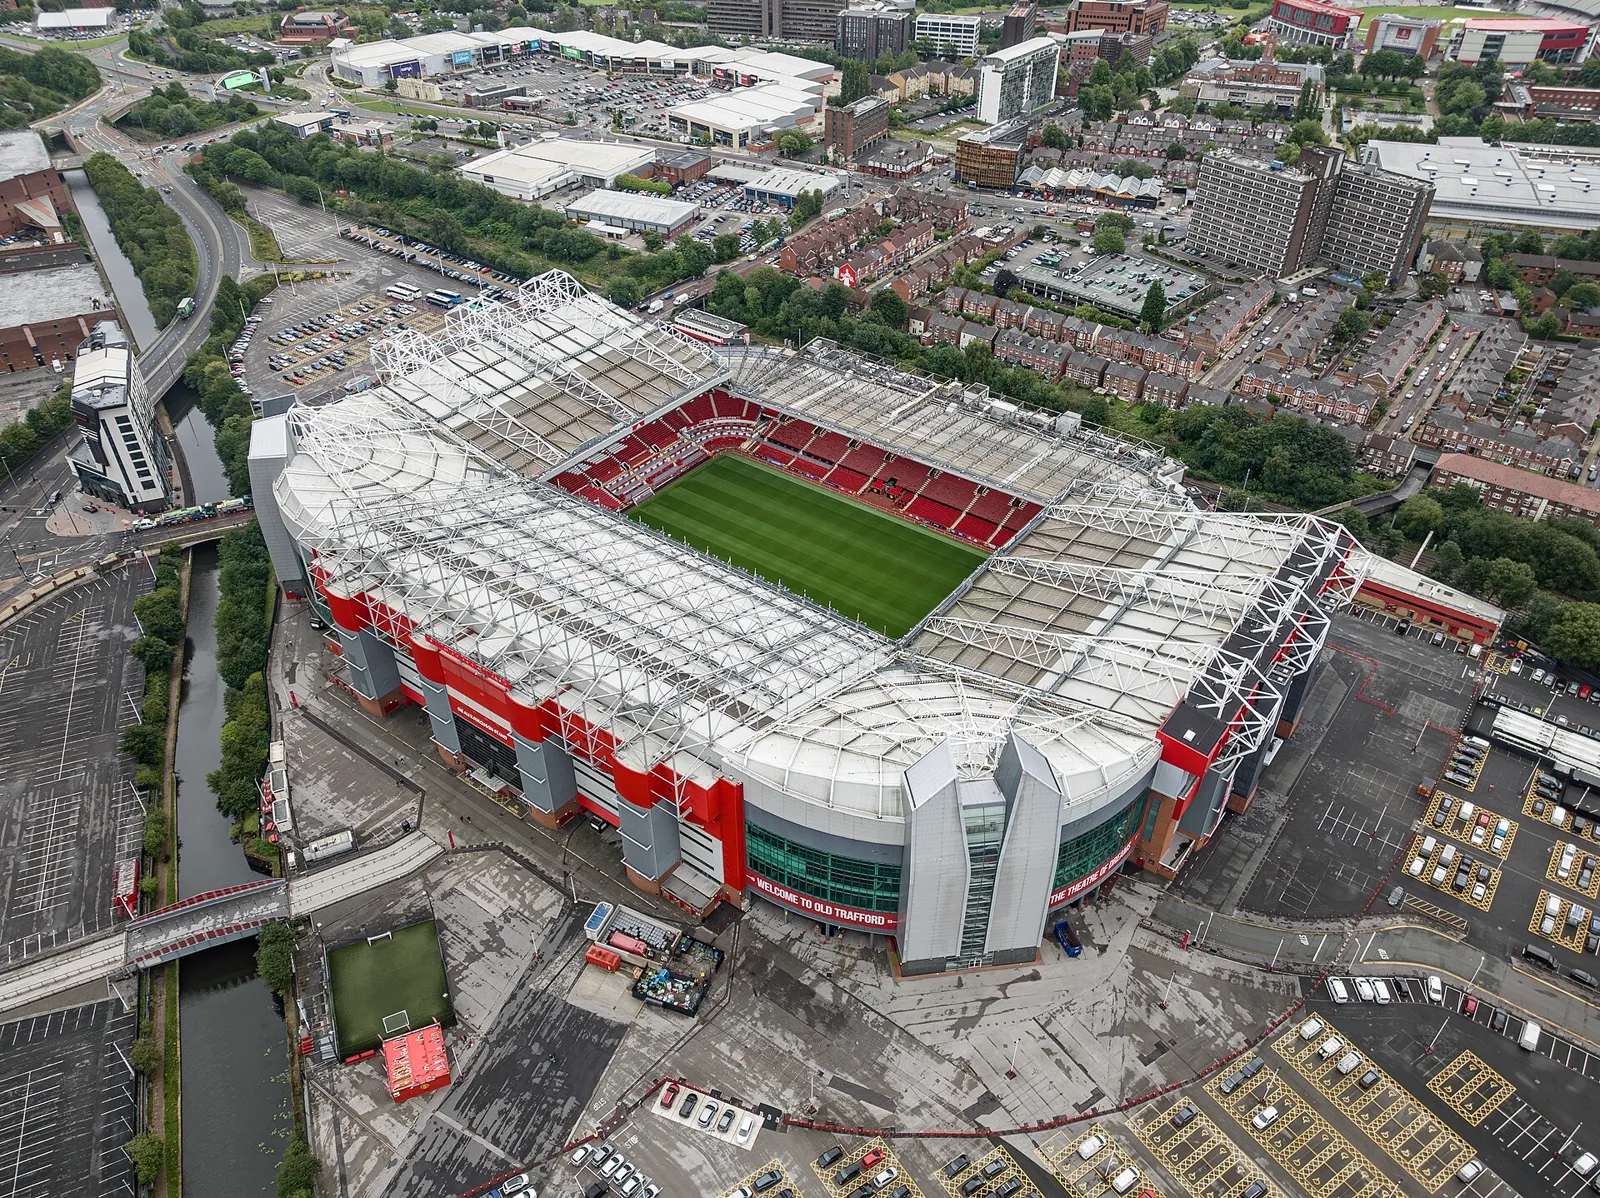
Old Trafford. Photo: Arne Müseler / arne-mueseler.com / Original source, CC BY-SA 3.0 de, cropped and resized.

Stored context before this match

Before this match, Man United have 7 scored home results and Bournemouth 7 scored away results stored in 2025-26. Statistical pre-kickoff PPG: Man United at home: 1.86 points per match (7 measured matches); Bournemouth away: 0.71 points per match (7 measured matches). Observed points use 3 for a win, 1 for a draw and 0 for a loss, before official adjustments. Man United scored 1.71 per home match (7 measured matches); Bournemouth scored 1.57 away (7). The competition's pooled scoring average was 1.41 per club appearance across 318 measured appearances. Both sides scored in 9 of 14 pooled club appearances (64.3%). A shared fixture counts once for each club's record. Earlier stored meetings: 10. Man United: 5 wins; Bournemouth: 3 wins; draws: 2.

Only scored source results before the recorded kickoff enter this statistical brief; same-day records with unknown kickoff order are excluded.

A plain reading of the stored figures. No verified written preview is current for this match.

How the goals came

No timeline: goal minutes, cards and substitutions are not stored for this match. The goals are shown by half instead.

First half21
Second half23

The match in numbers

Man UnitedBournemouth
  • 25Shots14
  • 9Shots on target9
  • 5Corners4
  • 15Fouls12
  • 2Yellow cards3
  • 0Red cards0

From shots to goals

Man United

  • Shots25
  • On target9
  • Goals4

36% of shots on target, 44% of those scored.

Bournemouth

  • Shots14
  • On target9
  • Goals4

64% of shots on target, 44% of those scored.

Counts only. Shot positions are not stored, so no shot map is drawn.

Prediction

Prototype model, not yet validated

No prediction is shown for a finished match. The model keeps no figure from before kick-off, so showing one now would be written with the result already known.

How the model works

Head to head

Meetings before this match. Same-day meetings qualify only when both recorded kickoff times establish an earlier start.

10 valid scored meetings from a bounded window of up to 10 stored meetings, any competition. Clean sheets count each named club separately; a 0–0 gives both clubs a clean sheet.

5
Man United wins
2
Draws
3
Bournemouth wins
Goals / meeting
3.20
32 goals in 10 meetings
Both scored
50%
5 of 10 meetings
Over 1.5
80%
8 of 10 meetings
Over 2.5
70%
7 of 10 meetings
Over 3.5
30%
3 of 10 meetings
Man United clean sheets
20%
2 of 10 meetings
Bournemouth clean sheets
30%
3 of 10 meetings
Corners / meeting
12.00
10 with corner data
Cards / meeting
4.10
10 with card data
  1. Bournemouth v Man UnitedSun, 27 Apr 2025 · Premier League 2024-251–1HT 1–0
  2. Man United v BournemouthSun, 22 Dec 2024 · Premier League 2024-250–3HT 0–1
  3. Bournemouth v Man UnitedSat, 13 Apr 2024 · Premier League 2023-242–2HT 2–1
  4. Man United v BournemouthSat, 9 Dec 2023 · Premier League 2023-240–3HT 0–1
  5. Bournemouth v Man UnitedSat, 20 May 2023 · Premier League 2022-230–1HT 0–1
  6. Man United v BournemouthTue, 3 Jan 2023 · Premier League 2022-233–0HT 1–0
  7. Man United v BournemouthSat, 4 Jul 2020 · Premier League 2019-205–2HT 3–1
  8. Bournemouth v Man UnitedSat, 2 Nov 2019 · Premier League 2019-201–0HT 1–0
  9. Man United v BournemouthSun, 30 Dec 2018 · Premier League 2018-194–1HT 3–1
  10. Bournemouth v Man UnitedSat, 3 Nov 2018 · Premier League 2018-191–2HT 1–1

Latest stored form

These are the clubs’ latest stored results across competitions, independent of this fixture’s date.

Any competition, newest first. The form chips read oldest to newest. C = corners, Y = cards (for and against).

Stored season rate grid

Arithmetic averages of both clubs' stored whole-season rates, with each source sample shown. These aggregates can include results after this fixture.

Man United at home, Bournemouth away
  • 68%
    Both teams scored
    League 56%
    19 + 19 matches
  • 95%
    Over 0.5 goals
    League 93%
    19 + 19 matches
  • 82%
    Over 1.5 goals
    League 79%
    19 + 19 matches
  • 61%
    Over 2.5 goals
    League 55%
    19 + 19 matches
  • 42%
    Over 3.5 goals
    League 28%
    19 + 19 matches
  • 29%
    Over 4.5 goals
    League 13%
    19 + 19 matches
  • 3.3
    Avg total goals
    League 2.75
    19 + 19 matches
  • 84%
    1st half over 0.5
    League 72%
    19 + 19 matches
  • 45%
    1st half over 1.5
    League 33%
    19 + 19 matches
  • 10.8
    Corners per match
    League 10.00
    19 + 19 matches
  • 74%
    Corners over 8.5
    League 66%
    19 + 19 matches
  • 61%
    Corners over 9.5
    League 56%
    19 + 19 matches
  • 53%
    Corners over 10.5
    League 44%
    19 + 19 matches
  • 4.5
    Cards per match
    League 3.85
    19 + 19 matches
  • 74%
    Cards over 3.5
    League 56%
    19 + 19 matches
  • 50%
    Cards over 4.5
    League 37%
    19 + 19 matches

Stored season context, 2025-26

Season figures include all stored results in this competition-season. Ratings use the latest stored calculation; these sections can include information after this fixture.

Season comparison, 2025-26

Man United at home, Bournemouth away
Man United (home)Bournemouth (away)
3Position6
WLWWWLast 5, oldest to newestDWWWD
19Played19
2.21Points per match1.37
68%Win %32%
2.05Scored / match1.53
1.26Conceded / match1.79
3.32Avg total goals3.32
68%Both scored68%
21%Clean sheets26%
11%Failed to score16%
–xG for–
–xG against–

Half by half

Man UnitedBournemouth
  • 0.951st half scored / match0.74
  • 0.371st half conceded / match0.84
  • 1.112nd half scored / match0.79
  • 0.892nd half conceded / match0.95
  • 58%Leading at half-time32%
  • 84%1st half over 0.584%
  • 42%1st half over 1.547%
  • 74%2nd half over 0.579%
  • 53%2nd half over 1.547%
  • 37%Scored in both halves32%

Goals, shots, corners and cards

Man United at home, Bournemouth away, this season.

Goals

Man UnitedBournemouth
  • 2.05Scored / match1.53
  • 1.26Conceded / match1.79
  • 3.32Match total / match3.32
  • 90%Scored 1+84%
  • 68%Scored 2+53%
  • 79%Conceded 1+74%
  • 37%Conceded 2+47%
  • 84%Match over 1.579%
  • 58%Match over 2.563%
  • 37%Match over 3.547%

Shots and xG

Man UnitedBournemouth
  • 17.89Shots for13.16
  • 10.32Shots against16.00
  • 6.84On target for4.84
  • 3.53On target against5.42
  • 12%Shot conversion12%

Corners

Man UnitedBournemouth
  • 5.26Corners for5.16
  • 4.47Corners against6.63
  • 9.74Match total11.79
  • 68%Over 7.595%
  • 58%Over 8.590%
  • 53%Over 9.568%
  • 37%Over 10.568%
  • 37%Over 11.547%

Cards

Man UnitedBournemouth
  • 1.79Cards for2.58
  • 2.68Cards against2.00
  • 4.47Match total4.58
  • 95%Over 2.579%
  • 74%Over 3.574%
  • 53%Over 4.547%
  • 21%Over 5.526%
  • 10.47Fouls committed12.53
Referee this season
S Hooper
Matches
15
Cards / match
4.13
15 matches
Over 3.5 cards
60%
15 matches
Over 4.5 cards
47%
15 matches
Fouls / match
23.33
15 matches

The table, 2025-26

#ClubPGDPts
1Arsenal384485
2Man City384278
3Man United381971
4Aston Villa38765
5Liverpool381060
6Bournemouth38457
7Sunderland38-654
8Brighton38653
Full table →

Where to watch

We do not store television or streaming listings for Premier League matches, so no broadcaster is named here. Your local listings or the competition organiser will have the rights in your country.

Broadcasters by countryOur stored rights cover the World Cup 2026 archive only.

Statistics only, never advice. Not affiliated with any league or club.