NotebookWorld Cup 2026 archive
Throw-Ins Over 30.5 at the World Cup: The Touchline Tells the Truth
Our signature market cleared its recalibrated line 69 times in 88 matches. What 36.6 throw-ins per game (and one strange ten-goal outlier) taught the model.
Written from stored results. The data is restored from the 11 October backup; current updates are not connected.
The match
This story covers the whole tournament, so it links no single fixture.
Advertise with MatchDaySync
Sponsor a page of football statistics
Your name beside tables, fixtures and club records. Tell us what you have in mind.
In numbers
- Goals per match3.20
333 goals across 104 stored World Cup 2026 results.
Source: Stored World Cup 2026 results - Results stored104
Matches of the tournament with a final score in the archive.
Source: Stored World Cup 2026 results

Free on MatchDaySync
Every free tool in one place
Finder, compare, predictions and more.
- Full record
- 69/88
- 78.4% hit rate
- Tournament average
- 36.6
- throw-ins per match
- Tournament high
- 59
- Türkiye 3–2 USA, group stage
- Tournament low
- 11
- France 4–6 England, third place
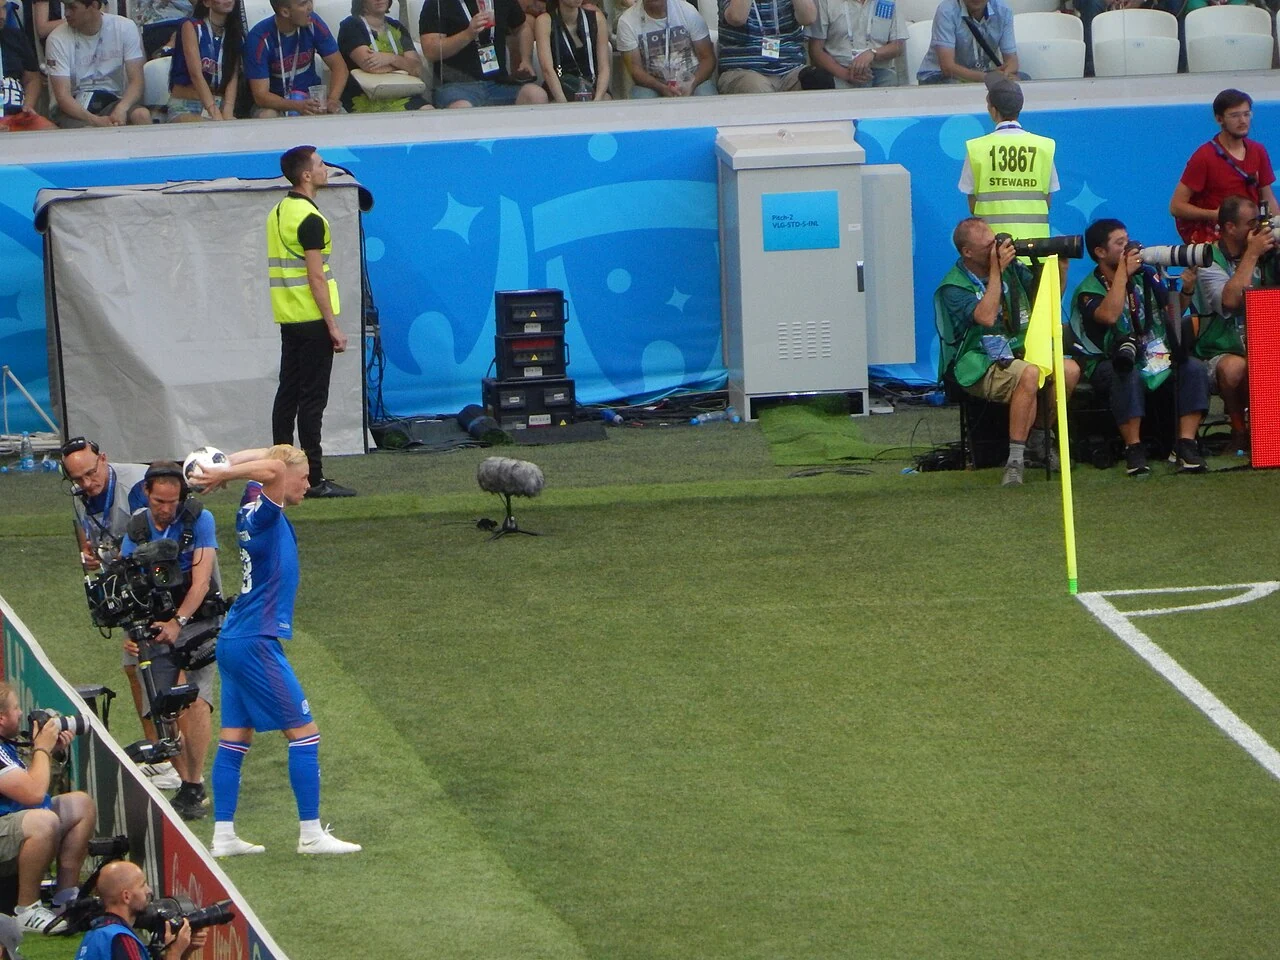
Throw-ins are the market that best rewards watching a match with the sound off. They pile up wherever football is contested rather than controlled (along the touchline, under pressing, in the scramble of hurried clearances) and this World Cup contested plenty. Across all 104 matches the tournament averaged 36.6 throw-ins per game, sitting comfortably above our recalibrated Over 30.5 line, and the projection record followed: 69 hits from 88 lines, a 78.4% cycle that shared second place on our board. The recalibration itself was the pre-tournament call we are most satisfied with. The line moved to 30.5 for this cycle after close study of how international sides use the flanks, and the 36.6 average suggests the threshold landed roughly where a well-set line should: cleared often, but never trivially.
The extremes taught the sharpest lessons. The tournament high of 59 arrived in Türkiye's 3–2 group-stage win over the USA: a frantic, territorial contest in which both teams treated the touchline as a pressure valve. The tournament low was stranger: just 11 throw-ins in France's 4–6 defeat to England in the third-place match, a ten-goal spectacle played almost entirely through the middle of the pitch. That pairing is the whole market in miniature. Throw-in volume is not a measure of entertainment; it is a measure of where a game lives. High-tempo, direct, duel-heavy football pushes the ball out of play constantly. Open, technical, transition football can produce chaos on the scoreboard while barely troubling the touchline. Reading which kind of match is coming (before kickoff) is precisely what the projection model is for.
From the GKM network
GKM Strategic Advisory and AI
Research, strategic advice, training, AI and digital solutions for institutions, businesses and individuals.
What the touchline taught us
Coin-flip, 50
Values in %.
The knockout sample added a small vote of confidence: 13 of 16 in the Round of 32, an 81.3% round that outperformed the group stage's 77.8%. As the ledger closes at 396 of 528 overall, throw-ins carry one clear instruction into the 2026-27 club season: this is the market most sensitive to competition style, so a single universal line would be malpractice. League-by-league recalibration happens before any club projection is published (club-season lines are not yet out) because a league built on pressing and direct play lives in a different throw-in universe from one built on patient possession. The World Cup told us the method works. The club season will tell us whether it travels.
- Line recalibrated to Over 30.5 for this cycle; final record 69 of 88 (78.4%).
- Tournament average: 36.6 throw-ins per match across all 104 games.
- High of 59 in Türkiye 3–2 USA (group stage); low of 11 in France 4–6 England (third-place match).
- Round of 32: 13 of 16 (81.3%), ahead of the 77.8% group stage.
Advertise with MatchDaySync
Reach readers who check the numbers
MatchDaySync pages are built around fixtures, tables and club statistics. Ask about a placement.
Sources
On the record
If a figure here is wrong, tell the desk and we will correct it on this page. Statistics only, never advice. MatchDaySync is not affiliated with FIFA or any league.
Free on MatchDaySync
Learn to read football statistics
Practical guides to samples, missing measurements and the limits of model estimates.
More from Field Notes
Corners Over 7.5 at the World Cup: The Hardest Line on the Board
The board's toughest market closed at 62.5% (still clear of the coin-flip) and delivered a 22-corner classic on the model's six-of-six night.
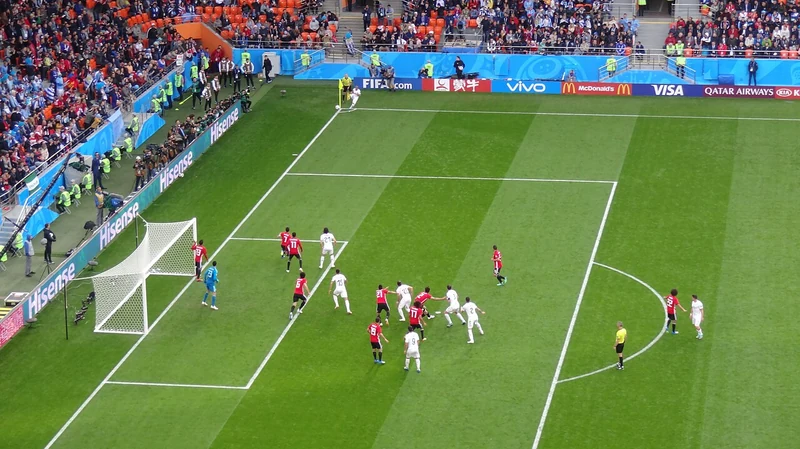
Carlos Sánchez taking a corner during Egypt–Uruguay, 15 June 2018. Historical World Cup corner illustration; this is not a photograph of the 2026 tournament. Photo: Soul Train / CC BY-SA 3.0. Original source. Resized and converted to WebP from the linked Commons file; aspect ratio retained. Licensed as linked. Fouls Over 18.5 at the World Cup: Projecting the Whistle
23.2 fouls per match, a 46-foul Final, and a 71.6% record: a season of learning to project the referee as much as the teams.

Felix Brych showing a yellow card during RB Leipzig–Union Berlin, 20 April 2022. Historical officiating illustration for the article’s fouls topic. It is not from the 2026 World Cup. Photo: Steffen Prößdorf / CC BY-SA 4.0. Original source. Resized and converted to WebP from the linked Commons file; aspect ratio retained. Licensed as linked. Shots on Target Over 6.5 at the World Cup: The Volatile Middle Child
From a 63.9% group stage to 13 of 16 in the Round of 32: the market that punishes wayward finishing found its range when the knockouts began.

Goalkeeper and goal-mouth action in the 2018 World Cup final, 15 July 2018. Historical illustration of the shots-on-target topic; this is not a photograph of the 2026 tournament. Photo: Meghdad Madadi / Tasnim News Agency / CC BY 4.0. Original source. Resized and converted to WebP from the linked Commons file; aspect ratio retained. Licensed as linked.


Keep reading
From the GKM network
Ghana travel guides and planning tools
Guides, tools and roadmaps for visiting, living and investing in Ghana. Every price is published.